
I'm Back.
It was nearly impossible to envision ever resurrecting Punt John Punt, a blog that we started in 2014. We had a lot more free time back then. After some rough Bill Lynch years winning just 3 conference games in 3 seasons and a slow start to the Kevin Wilson era including a 1-11 debut, the 2013 Indiana Hoosiers injected some fun into our lowly program. They still were generally bad, but they were fun to watch. The offense was good, scoring 40+ points in half the games. They also lost all 6 games in which they scored fewer than 40 points and another in which they scored 47(!).
It was sometime between Indiana beating a bad Penn State team for the first time ever and the fumbled lateral pass from Nate Sudfeld to Tevin Coleman late in the Minnesota game that we decided to devote more of our time to a football program that just a year prior had set the record for most all-time losses.
We had a good run. During our near decade running the Worldwide Leader in Nerdy Indiana Football Stats and Film Review, we developed a small, but loyal fanbase. But we both had exponentially less free time at the same time the football team had lost all momentum. As the fan base drifted away, it was easy for us to make our escape.
But then 10-0 happened. And Indiana made a CIGnificant investment in the future of their football program. So we fired up the stat machine to take a look down memory lane to illustrate just how good these Hoosiers are.
All of the metrics referenced below are from non-garbage time, FBS-only games (mainly because the 2015 defense takes enough of a beating as it is so let’s not include the Southern Illinois game).
Success Rate
In our metrics, a play is deemed “successful” when:
At least 50% of the yards-to-go are earned on 1st down (i.e. 5 yds. on 1st-and-10)
At least 70% of the yards-to-go are earned on 2nd down (i.e. 7 yds. on 2nd-and-10, or 5 yds. on 2nd-and-6)
100% of the yards-to-go are earned on 3rd and 4th down (i.e. you get a first down)
A Touchdown would also be considered a successful play, no matter the yards-to-go
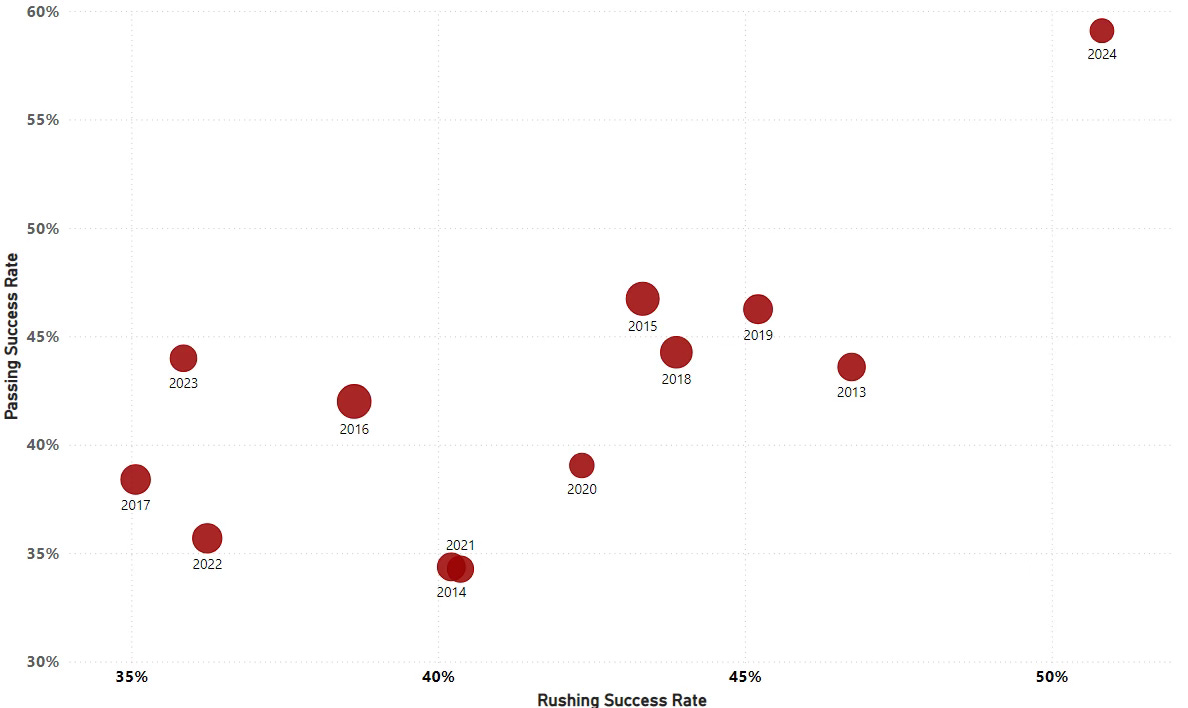
Indiana has been dominant both offensively and defensively this season.
Offensively, the 2024 efficiency is what is known as an outlier compared to the past decade. Even the productive Kevin Wilson years and the Kalen DeBoer year are essentially as close to the 2014 freshman Zander half-season and the 2021 Fall Off a Cliff season than they are the 2024 team.
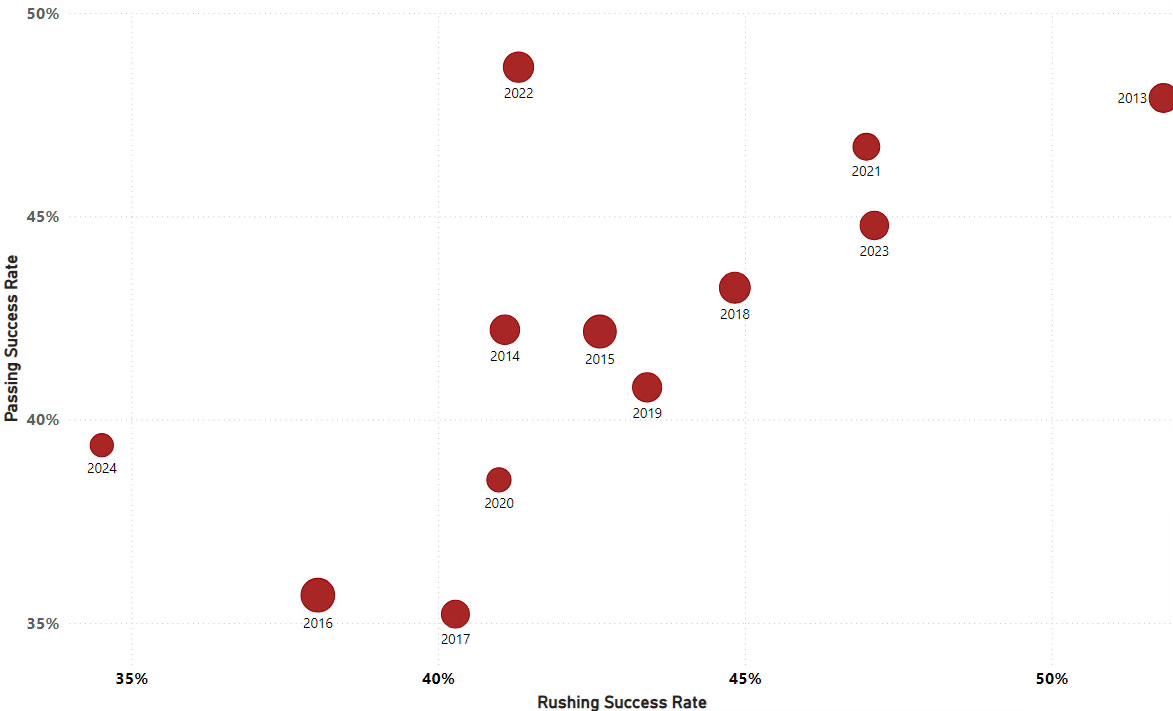
The defense is right up there with the best of Tom Allen. The 2024 Hoosiers are tougher against the rush, giving up a little bit more against the pass. This year’s defense is allowing an overall 37% success rate, right in line with 2016 and a percentage point better than 2017.
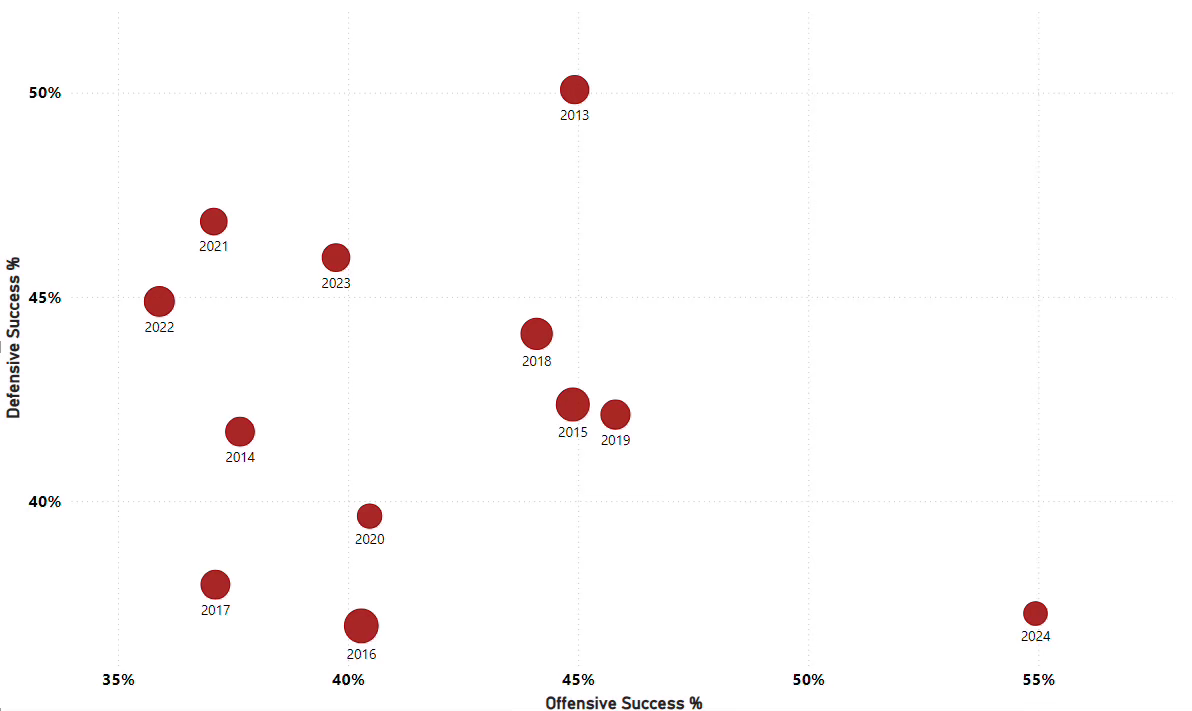
Overall, the 2024 Hoosiers are in the upper echelon in both offensive and defensive success rates, something that has often seemed to be an either/or.
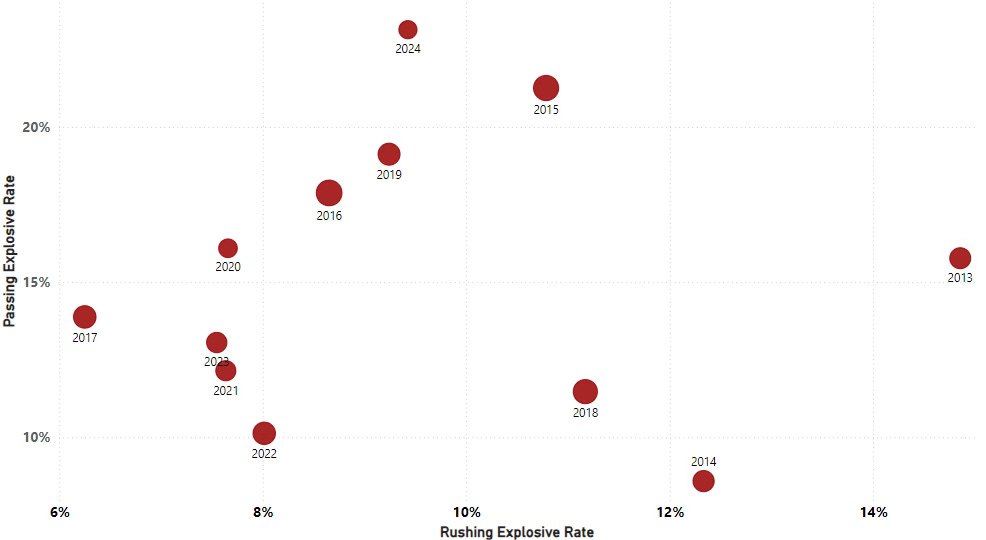
Explosiveness
In our metrics, a rush of 12+ yards or a pass of 15+ yards is deemed “explosive”.
Indiana’s running game has been more efficient than explosive. As you would expect, the Tevin Coleman years lead the way in terms of rushing explosive rate. But the passing game has been extremely explosive, besting the Senior Sudfeld season and the Prime Penix season.1
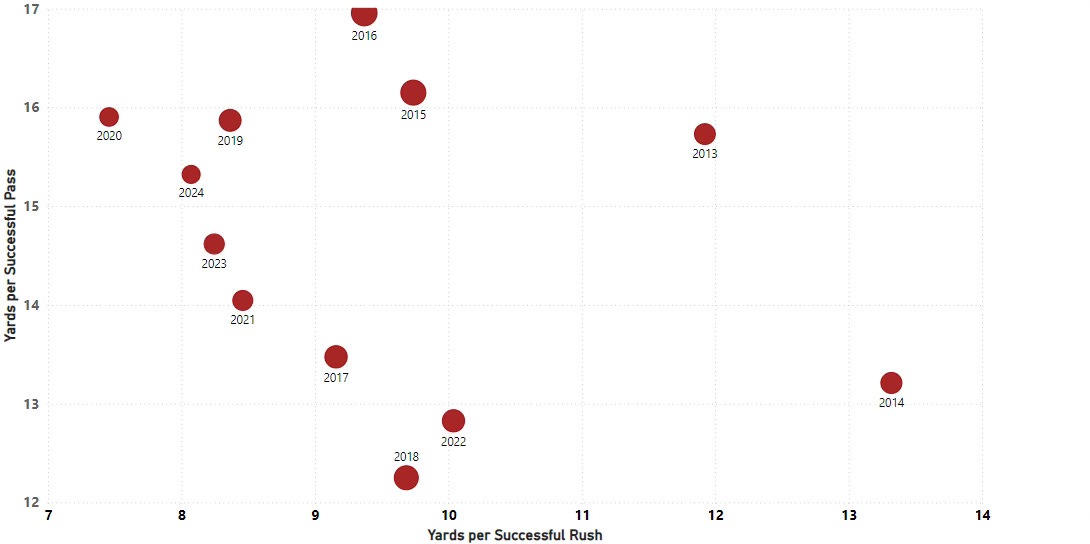
Looking at yards per successful play, not how often are you having an explosive play, but when you have a successful play, how successful is that play, you’ll notice Indiana is near the bottom in rushing yards per successful play and slightly above average in passing. Sure we’d all love a running game with breakaway speed, but the formula is working for the offense. The running game is so efficient at keeping drives alive that it opens up the passing game to pick up the chunk plays.
Defense, take a bow. People have mentioned how overlooked the defense has been in comparison to the high-scoring Hoosier offense. It’s true! But it is also amazing to see just how dominant this defense has been at forcing the opponent to methodically move down the field. No easy task.
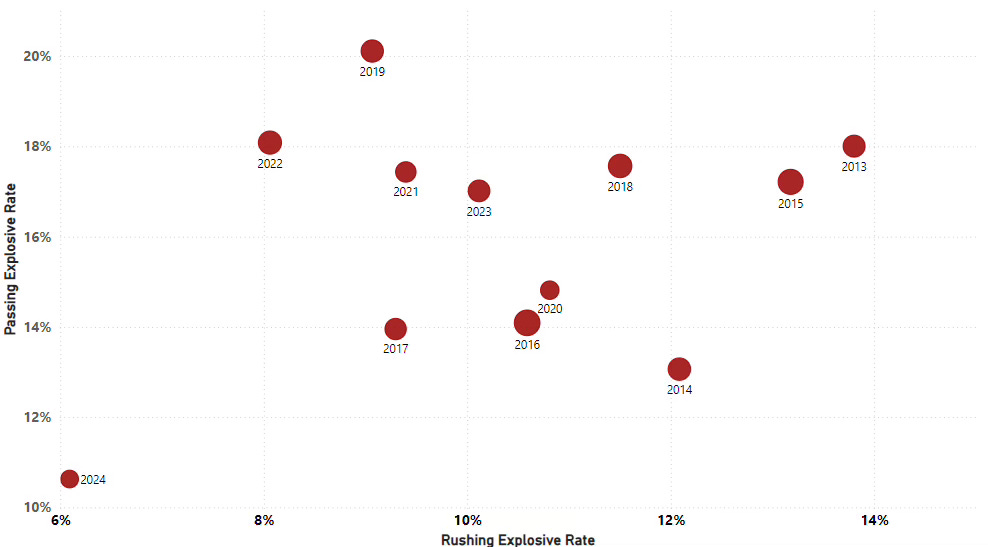
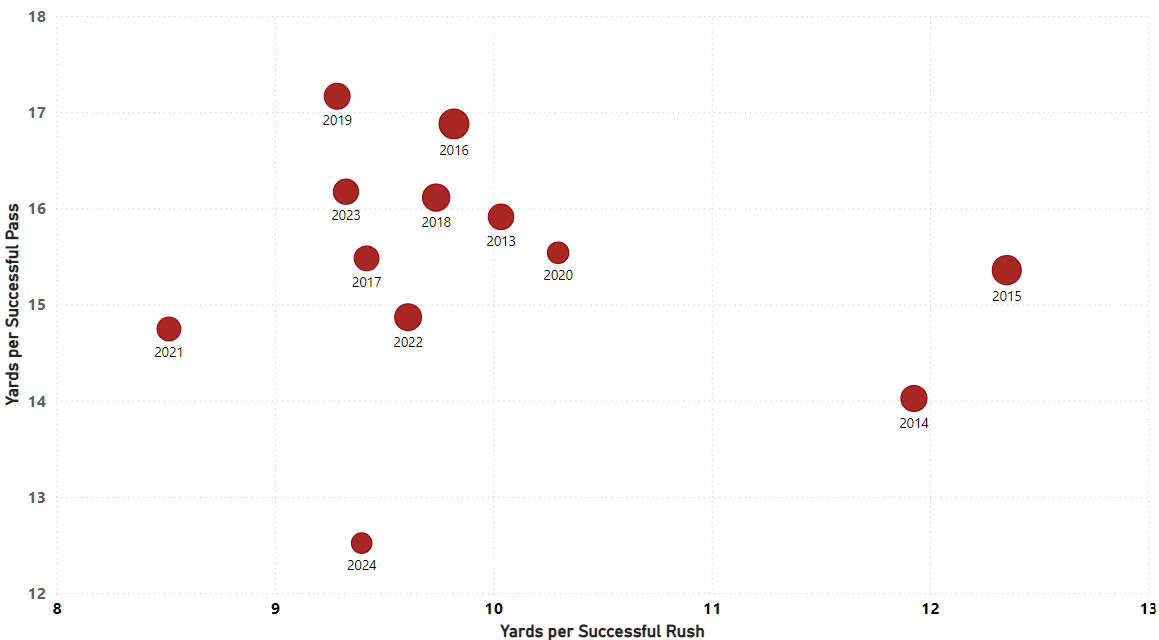
As evidenced below, not only does Indiana not allow a high rate of explosive plays, but the ones they do allow tend to be on the lower end.
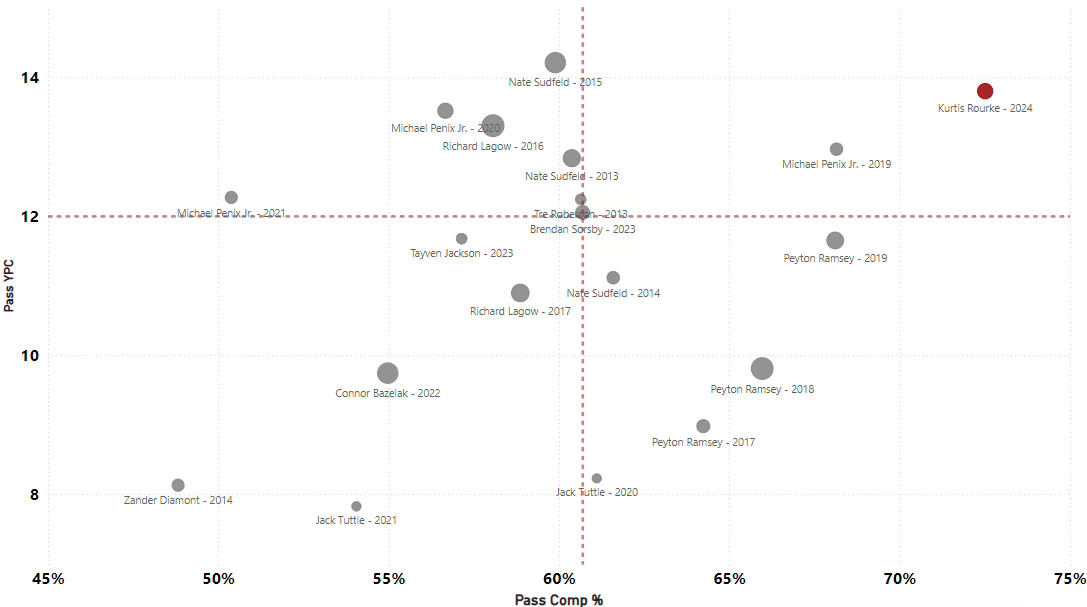
Kurtis Rourke is reaching the Benchable Tier
Rourke nearly has the best season in terms of yards per completion, just under Nate Sudfeld’s senior campaign of 12.8. His completion percentage is OFF THE CHARTS (no actually, I just adjusted the chart for you, dear reader). But this isn’t just a dink and dunk Peyton Ramsey passing game that we saw under Mike DeBord. This is a downfield, big plays, let’s score some points and not let the ball hit the ground offense.
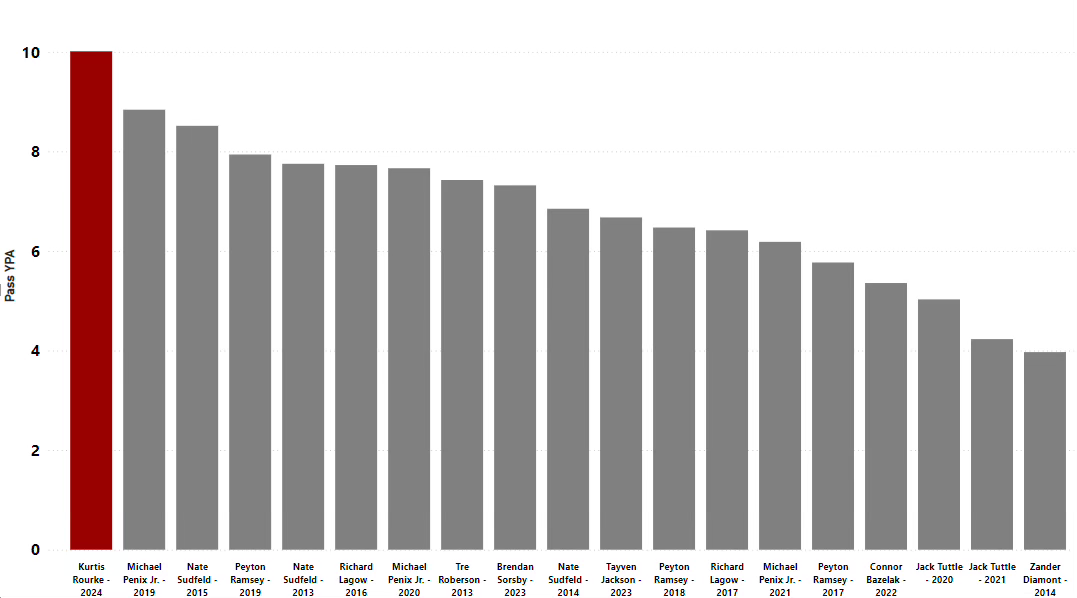
Combine the completion percentage with the yards per completion and it’s no wonder that Rourke owns the highest yards per passing attempt of any Indiana quarterback since 2013 by a healthy margin.
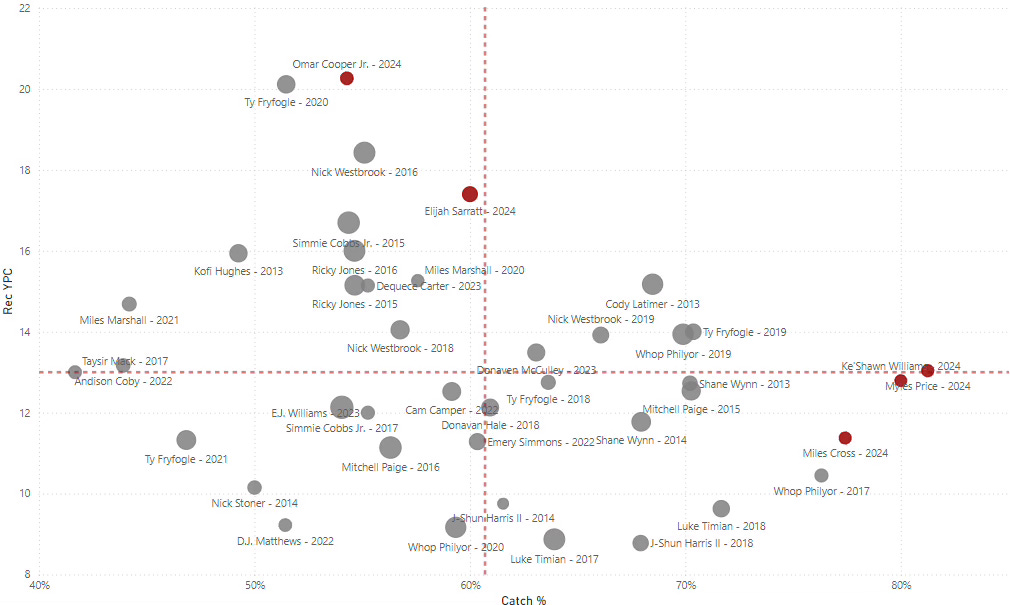
Putting the catch in pass-catcher
Credit the coaching staff for putting together such a talented, but complimentary position group.
Indiana is led by Elijah Sarratt who finds himself in the Nick Westbrook division. Likewise, it wouldn’t be surprising to see Sarratt on Sundays someday. Omar Cooper has provided the biggest of big plays this year, beating even the incredible Ty Fryfogle campaign of 2020 where it seemed like all he did was make explosive plays.
These aren’t Indiana’s only two receivers. The Hoosiers have 3 more WRs with a target share above 10% and all they do is catch the ball. Myles Price, Ke’Shawn Williams, and Miles Cross have the top 3 catch rates of any Indiana receiver since 2013. Their production makes it much more difficult for defenses to focus on just Sarratt and Cooper. It’s a passing game that can beat you in many different ways.
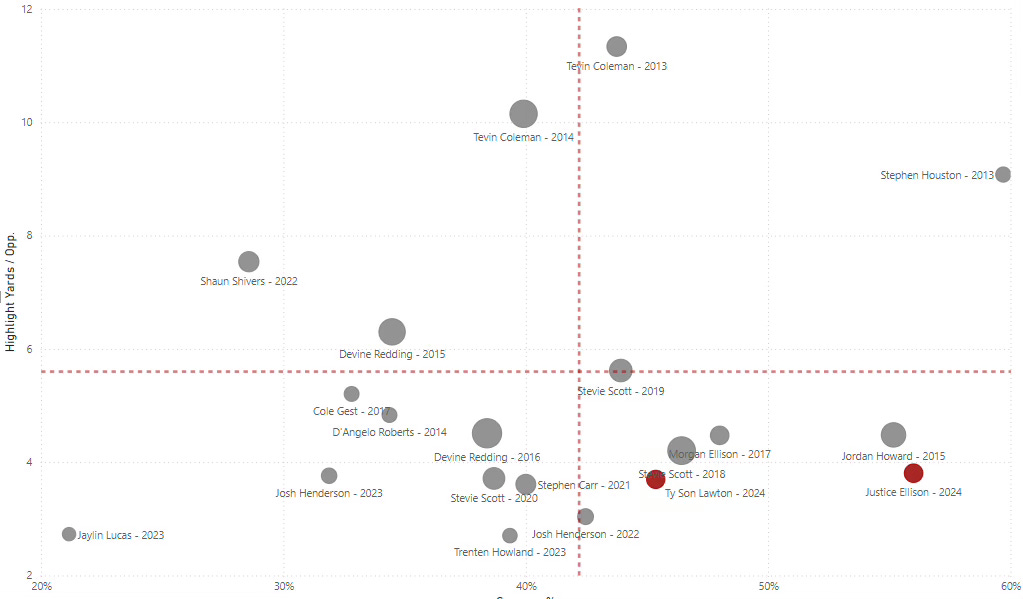
Justice Ellison, reaching Jordan Howard levels
Ellison has been a big factor in the efficiency of the Indiana running game. Statistically, he’s right there with Jordan Howard which is remarkable given Howard’s talent and productive NFL career. His partner in the backfield, Ty Son Lawton, has been slightly less efficient but still productive. Both backs are below average in highlight yards per opportunity (fancy for when a RB has a big run, how big is it. See Coleman, Tevin), but make up for it in above average success rate.
Special shoutout to Stephen Houston who was overshadowed by Tevin Coleman in 2013 but was still one of my favorites.
Bob Bostad Appreciation Section
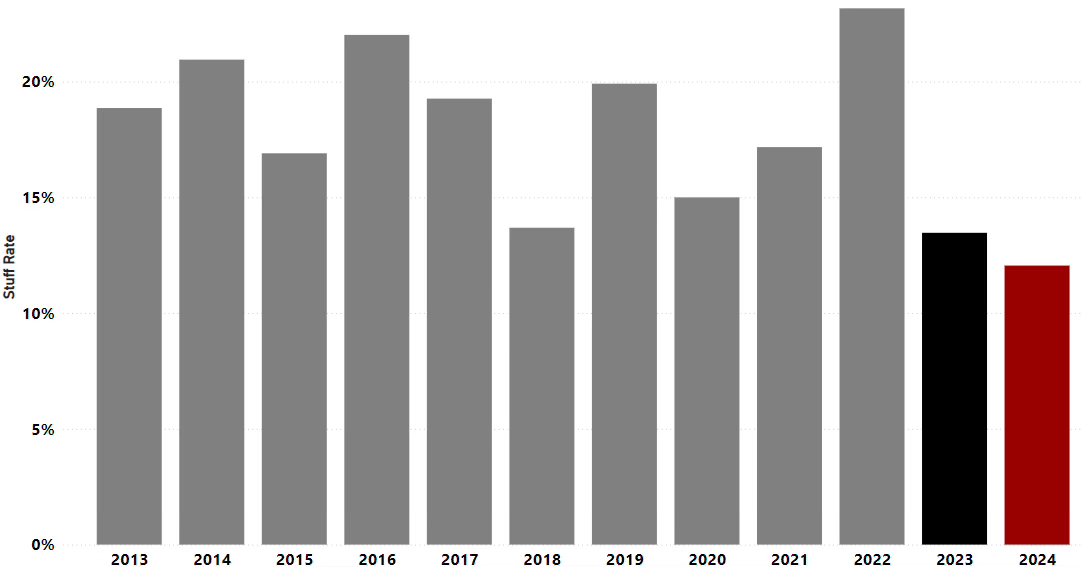
Offensive Line coach Bob Bostad was hired by Tom Allen in 2023 and, for good reason, was retained by Curt Cignetti. The man has done wonders for the offensive line. On running back rushes, the past 2 seasons have had the lowest stuff rate (rushes gaining 0 or negative yards). Maybe the 2023 Hoosiers just had RBs with the ability to not lose yards. And maybe Indiana brought in completely new RBs in 2024 along with a new running backs coach and the new backs also have the ability to not lose yards. They are probably better in that area than some in past seasons. But it is impossible to not see Bostad’s impact on an offensive line that is getting push and opening running lanes.
This season Indiana’s RBs also have the highest opportunity rate (rushes of 5+ yards) of any season. There’s a reason Justice Ellison said “It was like the Red Sea” against Nebraska.
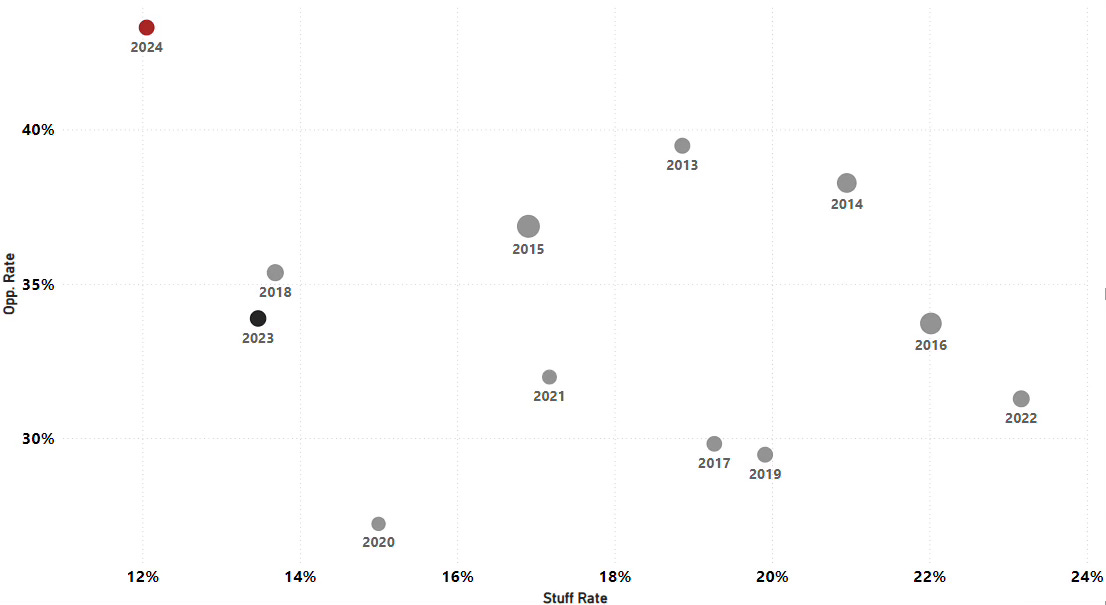
I think we need a bar chart as well to really highlight his impact.
There’s so much more we could touch on with this team. If you like Indiana football and stats (if you don’t I’m not sure why you’re still reading this) and haven’t subscribed to Bite-Sized Bison yet, you really need to. Taylor has done an incredible job providing data-driven analysis on Indiana football.2 It’s been fantastic to still be able to indulge in nerdy IU stats.
Maybe we’ll post again in the offseason. Or maybe this is it, like a cicada popping up to say hello. Or maybe we’ll make this site our own personal Once Upon a Time in Shaolin and sell a single paid subscription.
The quantity wasn’t there in 2019, but I personally think the 2019 version of Michael Penix with Kalen DeBoer outperformed the 2020 season. Higher completion percentage, yards per attempt, success rate, etc.
His Ohio State preview is free so give it a read.